Ram Chillarege, Inderpal S. Bhandari, Jarir K. Chaar, Michael J. Halliday, Diane S. Moebus, Bonnie K. Ray, Man-Yuen Wong, IBM Thomas J. Watson Research Center, 1992
Abstract -- This paper describes Orthogonal Defect Classification (ODC), a concept that enables in-process feedback to developers by extracting signatures on the development process from defects. The ideas are evolved from an earlier finding that demonstrates the use of semantic information from defects to extract cause-effect relationships in the development process. This finding is leveraged to develop a systematic framework for building measurement and analysis methods. This paper:
- Defines ODC and discusses the necessary and sufficient conditions required to provide feedback to a developer.
- Illustrates the use of the defect type distribution to measure the progress of a product through a process.
- Illustrates the use of the defect trigger distribution to evaluate the effectiveness and eventually the completeness of verification processes such as inspection or testing.
- Provides sample results from pilot projects using ODC.
- Opens the doors to a wide variety of analysis techniques for providing effective and fast feedback based on the concepts of ODC.
Published:IEEE Transactions on Software Engineering, Vol 18, No. 11, Nov 1992. Copyright 1992 IEEE.
Table of Contents:
-->
Orthogonal Defect Classification
The difficulty in developing methods and techniques to bridge the gap between theory and practice in in-process measurements stems from a very fundamental issue - the lack of well defined cause-effect relationships that are validated over time. Without a good sense of cause and effect, it is very hard to develop methods that provide good feedback to a developer. Yet, until recently methods to identify such existence and crisp techniques to measure it were not developed.
A recent study embarked on exploring the existence of relationships between the semantics of defects and their net result on the software development process [15]. The choice of semantics of defects was intentional since, it could become a vehicle that provides a measure of the state-variables for a development process. The study showed that when defects were uniquely categorized by a set of defect types, representing the semantics of the fix, it was possible to relate changes in the shape of the reliability growth curve to defects of a specific type. The defect types could be associated with the activities of the different stages of development. Thus, defects of a specific type were due to some cause in the process and the shape of the reliability growth curve represented an effect on the process. In the study, sub-groups that had larger than average proportion of initialization defects yielded growth curves that were very inflected - confirming the theory that errors early in the code path (viz. initialization) hide other defects causing the growth curve to inflect [9]. Had such in-process measurements on defect type been available, developers could compensate for problems by altering test strategy. Similarly, a substantial number of function defects prompted questioning of the design process. In hindsight, it was learned that the design process had much to be desired. The study demonstrated that a simple classification scheme could reveal insight into process problems faced during development. It was subsequently recognized that a semantic classification could be exploited to provide in-process feedback. The study demonstrated the existence of a measurable cause-effect relationship that could open the doors to a host of viable alternatives.
Orthogonal Defect Classification (ODC) essentially means that we categorize a defect into classes that collectively point to the part of the process which needs attention, much like characterizing a point in a Cartesian system of orthogonal axes by its (x, y, z) coordinates. In the software development process although activities are broadly divided into design, code, and test, each organization can have its variations. It is also the case that the process stages in several instances may overlap while different releases may be developed in parallel. Process stages can be carried out by different people and sometimes different organizations. Therefore, for classification to be widely applicable, the classification scheme must have consistency between the stages. Without consistency it is almost impossible to look at trends across stages. Ideally, the classification should also be quite independent of the specifics of a product or organization. If the classification is both consistent across phases and independent of the product, it tends to be fairly process invariant and can eventually yield relationships and models that are very useful. Thus, a good measurement system which allows learning from experience and provides a means of communicating experiences between projects has at least three requirements:
- orthogonality,
- consistency across phases, and
- uniformity across products.
One of the pitfalls in classifying defects is that it is a human process, and is subject to the usual problems of human error, confusion, and a general distaste if the use of the data is not well understood. However, each of these concerns can be handled if the classification process is simple, with little room for confusion or possibility of mistakes, and if the data can be easily interpreted. If the number of classes is small, there is a greater chance that the human mind can accurately resolve between them. Having a small set to choose from makes classification easier and less error prone. When orthogonal, the choices should also be uniquely identified and easily classified.
Necessary Condition
There exists a semantic classification of defects, from a product, such that the defect classes can be related to the process which can explain the progress of the product through this process.
If the goal is to explain the progress of a product through the process, the simple case of asking the programmer fixing the defect, ``where are the problems in this product?'' is the degenerate solution to the problem. This question is implied by classifications such as ``where injected?'' that rely on the intuition of the programmer to directly map defects to process stages. However, practitioners are quick to point out that the answer to the above question requires stepping back from the process; conjecturing can vary dramatically in both the accuracy and the validity of their answer. Such direct classification schemes, by the nature of their assumptions, qualify as good opinion surveys, but do not constitute a measurement on the process.
The above goal can be achieved by capturing the details of a defect fix in a semantic classification that is subsequently related to the process. An example of such semantic classification is ``defect type'' which captures the meaning of the fix. Since defect type does not directly translate into ``where are the problems in this product?'', it needs to be mapped to the process. This mapping provides the relation between defect types and the process, which enables answering the above question. Thus, semantic classification provides measurements on the process that can yield an assessment of the progress of a product through the process.
Semantic classification is likely to be accurate since it is tied to the work just completed. It is akin to measurements of events in the process, as opposed to opinions on the process. There is an important advantage in the semantic classification of a defect, such as defect type, over an opinion-based classification, such as where injected. The semantic classification is invariant to process and product, but requires a mapping to process stages. This mapping is a level of indirection that ties a semantic class to a specific process stage(s). The cost of this indirection is reflected in the need to calibrate the distribution of these semantic classes for specific processes.
The opinion-based classification suffers in several ways. Firstly, as noted, the classification is error-prone. Secondly, it is very specific to a process and therefore does not map between different processes. Finally, it cannot work where the process is not well defined or the process is being changed dynamically to compensate for problems.
Clearly, semantic classification has advantages. To be able to measure the progress of a product, the mapping of semantic classes to the process should be feasible. Essentially, a set of such semantic classes should exist that maps to the process. Classification can always have some degree of subjectivity, however, orthogonality reduces the human error in classification by providing classes that are distinct and mutually exclusive.
Sufficient Conditions
The set of all values of defect attributes must form a spanning set over the process sub-space.
The sufficient conditions are based on the set of elements that make up an attribute, such as defect type. Based on the necessary conditions, the elements need to be orthogonal and associated to the process on which measurements are inferred. The sufficient conditions ensure that the number of classes are adequate to make the necessary inference. Ideally, the classes should span the space of all possibilities that they describe. The classes would then form a spanning set with the capability that everything in that space can be described by these classes. If they do not form a spanning set then there is some part of the space that we want to make inferences on that cannot be described with the existing data. Making sure that we have the sufficiency condition satisfied implies that we know and can accurately describe the space we want the data to project into.
Given the experimental nature of the work, it is hard to apriori guarantee that sufficiency is met with any one classification. Given that we are trying to observe the world of the development process and infer about it from the defects coming out, there are the tasks of (a) coming up with the right measurement, (b) validating the inferences from the measurements with reference to the experiences shared and (c) improving the measurement system as we learn more from the pilot experiences. However, this is the nature of the experimental method [19]. For example, in the first pilot[15], the following defect types evolved after few classification attempts, function, initialization, checking, assignment, and documentation. This set, as indicated earlier in this section, provided adequate resolution to explain why the development process had trouble and what could be done about it. However, in subsequent discussions [16] and pilots it was refined to the current eight. Given the orthogonality, inspite of these changes several classes, such as function and assignment and the dimension they spanned (associations) remained unchanged.
Classification for Cause-Effect
Collecting the right data that can provide a complete story to relate cause attributes with effect can provide an organization a gold mine of information to learn from. Figure 1 shows three major groups of data that are important to have. One group are the cause attributes which when orthogonally chosen provide tremendous leverage. So far, we have mentioned defect type and later in the paper we will discuss defect trigger. The second group is meant to measure effect - which could include explicit measures of effect or those computed as a function of other measures. Traditionally there have been several ways to measure effects. An explicit measure commonly used in IBM is severity; the severity of a defect is usually measured on a scale of 1-4. More recently, the impact of field problems on a customer is captured in a popular IBM classification: CUPRIMD [20], standing for Capability, Useability, Performance, Reliability, Installability, Maintainability and Documentation. Other measures of impact which are functions computed over existing data include Reliability Growth, Defect Density, etc. The third group is really meant to identify sub-populations of interest. These are typically attributes that distinguish projects, people, processes, tools etc. The list is limitless in that it could include almost any attribute which is considered meaningful to track. The availability of such sub-populations identifiers is very valuable and would provide an ideal fishing ground to study trends similar to those undertaken in market segmentation and analysis studies.
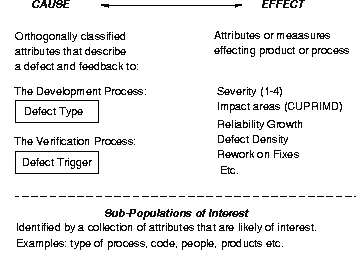
Figure 1: ODC Data to Build Cause Effect Relationships
The Defect Type Attribute
The ideas on Orthogonal Defect Classification become much clearer when we discuss the defect type attribute. A programmer making the correction usually chooses the defect type. The selection of defect type is implied by the eventual correction. These types are simple, in that they should be obvious to a programmer, without much room for confusion. In each case a distinction is made between something missing or something incorrect. A function error is one that affects significant capability, end-user interfaces, product interfaces, interface with hardware architecture, or global datastructure(s) and should require a formal design change. Conversely, an assignment error indicates a few lines of code, such as the initialization of control blocks or datastructure. Interface corresponds to errors in interacting with other components, modules or device drivers via macros, call statements, control blocks or parameter lists. Checking addresses program logic which has failed to properly validate data and values before they are used. Timing/serialization errors are those which are corrected by improved management of shared and real-time resources. Build/package/merge describe errors that occur due to mistakes in library systems, management of changes, or version control. Documentation errors can affect both publications and maintenance notes. Algorithm errors include efficiency or correctness problems that affect the task and can be fixed by (re)implementing an algorithm or local datastructure without the need for requesting a design change.
The choice of defect types have evolved over time from the original five types [15], which were refined by working with the IBM Mid-Hudson Valley Programming Lab [16] to eight. The idea is to capture distinct activities in fixing a defect which, given the programming paradigm, are limited in degrees of freedom. Thus, there are only so many distinct things possible when fixing a defect. Adding a new capability to software (function) is quite different from a small change in a few lines of code say to correct values of variables (assignment). When the choices are orthogonal it also leaves little room for confusion. Our experience, so far, is that the increase from five to eight occurred in dimensions relating to moving from a proof of concept to a production environment. For example, some of the new types were related to the mechanics of large development (build/package/merge), concurrency (serialization) which did not exist in the serial software in the first exercise. Thus, it did not effect the dimensions that the original set spanned. Similarly, it might be possible to collapse classes if their associations map to identical process stages and the added resolution is not desired. Eventually, the idea is to arrive at classes that satisfy both the necessary and sufficient conditions.
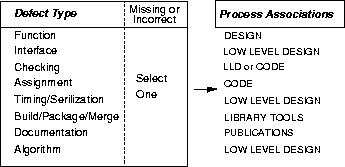
Figure 2: The Defect Type and Process Associations
The defect types are chosen so as to be general enough to apply to any software development independent of a specific product. Their granularity is such that they apply to any phase of the development process, yet can be associated with a few specific phases in the process. The defect types should also span the space of these phases to satisfy the sufficient condition. Figure 2 shows the defect types, and associates a phase of the development process with each of these types. If a function defect is found, whether it be in system test or unit test, it still points to the high level design phase that the defect should be associated with. Similarly, a timing error would be associated with low level design. The set of defect types are different enough that they span the development process. Given this set of defect types, there are several opportunities for providing feedback to the developer based on the profiles of the defect type distribution.
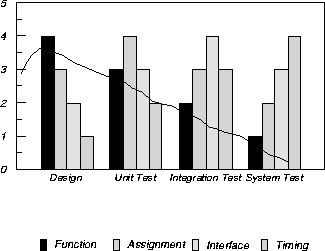
Figure 3: Change in the Defect Type Distribution with Phase
Exploiting the Defect Type
Figure 3 shows an example that illustrates exploiting orthogonal defect types. Four defect types are used for this example: function, assignment, interface and timing. In each phase of development, a distribution of the defect types is shown, normalized by the number of defects in this phase. Given a development process one can describe the expected behavior. For instance, in most development processes where a design is conducted prior to coding and testing, the function defects should be found early in the process and ideally very few at system test. Thus, the bar corresponding to function defects should be diminishing through the process. On the other hand, it is understandable that more timing and serialization defects are found during system test. Assignment and interface defects can have profiles that peak at unit-test and integration test, respectively. Essentially, the defect type distribution changes with time, and the distribution provides an indication of where the development is, logically.
The change in distribution of the defect type thus provides a measure of the progress of the product through the process. At the same time, it provides a means to validate if a development is logically at the same place as it is physically. For instance, if at system test the profile of the distribution looks like it should be in unit test or integration test, then the distribution indicates that the product is prematurely in system test. The profile of the distributions provides the signatures of the process. When a departure in the process is identified by a deviation in the distribution curve, the offending defect type also points to the part of the process that is probably responsible for this departure.
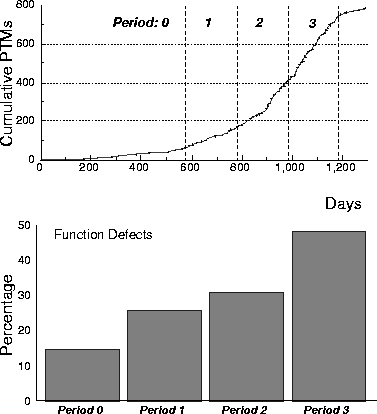
Figure 4: Total Defects and Proportion of Function Type Defects
Pilot Results
The use of defect type is illustrated best by one of the early test pilots undertaken. A software component was chosen which, in hind sight, we knew had a difficult development history. Towards the end of its development, it had become evident that several process changes should have been made earlier in the cycle. The exercise here is to show how the defect type distribution would have signaled the problem and recommended a plausible correction. Figure 4 shows the overall reliability growth curve of the component. The curve is divided into four periods, the last three being approximately six months each. In the last period the number of defects almost doubled, and corresponds approximately to the system test phase. For the purpose of the study we drew the lines demarcating the periods at six month intervals and drew samples for classification. The granularity of the analysis is thus limited to these predetermined sampling intervals. In practice there will not be this sampling effect and analysis conclusions can be made at much finer intervals.
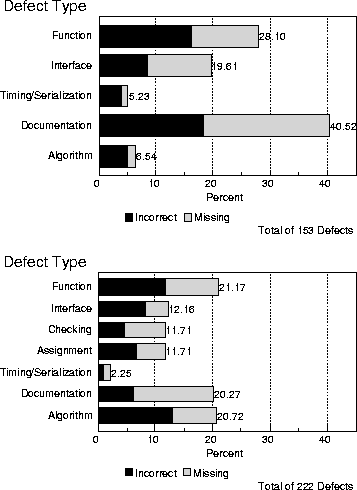
Figure 5: Defect Type Distributions through Design Review
The lower part of Figure 4 shows the distribution of the defect type function. Each bar in the distribution corresponds to the fraction of defects of that type in that period. The departure in the process is clearly recognized by the distribution of the function defect type. Note that the increase of type function at period 3 may be because the period corresponds to the function test phase where function defects may be expected to increase. However, by the final period, function defects have increased to almost half of the total indicating that the final testing of the integrity of the software is being hampered by the failing of functionality. This trend will cause an alert since is it a significant deviation from expected behavior. Given that function defects were the cause of the departure, they also suggest an appropriate (design) re-review or inspection rather than more intensive testing.
It takes time to calibrate the change in distribution within a particular development process, but until calibration is complete trend analysis can still be used to infer whether a process is making progress in the right direction. In the following figures, examples are shown pertaining to different parts of the development process to provide an illustration of the change in distribution. Given that ODC has been introduced only in the past year it is not yet possible to provide data of products from beginning to end. However, we are able to illustrate from a few snapshots across the phases.
Figure 5 shows distributions of defects discovered at high-level design and low-level design respectively. The trend across these two stages indicates (1) a decline in the proportion of defect types function and interface and, (2) an increase in the proportion of algorithm. Both of these trends are considered healthy, as (1) function and interface are expected to diminish as the design becomes more detailed and, (2) algorithm is expected to increase as the more detailed design is examined.
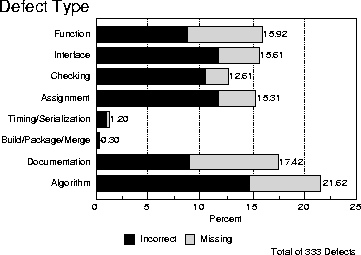
Figure 6: Defect Type Distribution in Code Inspection
Figure 6 continues this healthy trend across the code inspection stage, as function decreases and assignment and checking increase under the scrutiny of this evidently effective inspection process.
Figure 7, conversely, indicates an unhealthy trend. The two distributions are taken respectively from function verification test and system test. The preponderance of interface over all other defect types is alarming at both of these execution test stages. Function verification test is expected to uncover defects of type function but found only a small proportion. Defects of type assignment should have been discovered during code inspection or unit test, but they continue to increase at these late stages in the cycle.
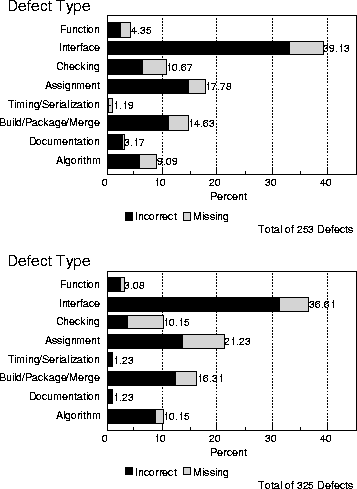
Figure 7: Defect Type Distributions through Test
Given that the defect type distribution changes with a function of time, reliability growth of individual defect types provides another avenue to measure maturity of the product. Initial experiments with this approach were found to produce some better fits for long term prediction. [21] illustrates the use of a modified S shaped growth model for typed data.
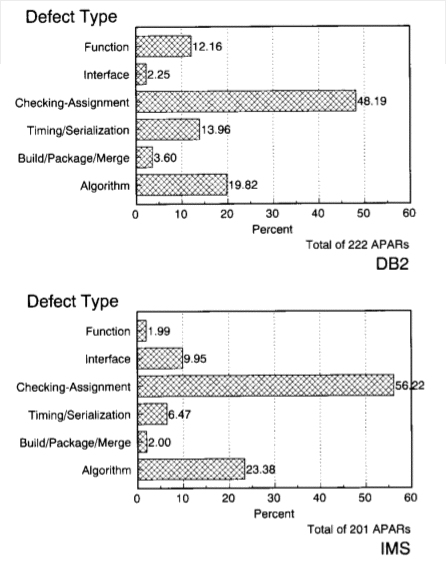
Figure 8: Defect Type Distributions for DB2 and IMS
In a recent study on comparing software errors from two database systems [22], it has been found that the field late-life defect type distribution is dominated by assignment and checking types of defects. This seems reasonable given that they are the few lines of code that typically ignore a condition or incorrectly assign a value. This same study also finds that the fraction of function defects is lower in older products (i.e., IMS compared to DB2) as seen in Figure 8 taken from [22]. Furthermore, an interesting analysis of a potentially asymptotic property in the error type distribution is identified using the defect-type. This furthers the case for this granularity of the classification and provides additional insights into its value.
Process Inferencing
We now take the trend analysis a stage deeper to illustrate the potential automation that is possible using ODC. Figure 9 shows a principal association table that has more details than Figure 2. Down the columns are the different defect types and along the rows are the process verification stages. The dots in the table identify the principal associations. For example, the defect type function is associated with design (as before) and can be expected to be detected at both the high level design inspection and also function verification test. The principal associations thus show where defects of type function may peak. By construction, we should also expect valleys before and after the principal association stages. This table thus describes the profiles of the defect type distribution explicitly. Departures from these profiles reflect potential problem areas. To illustrate how the departures are recognized, we present an example with the defect type function.
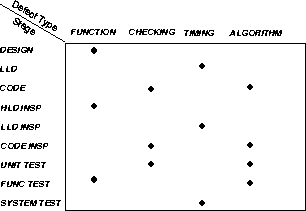
Figure 9: Principal Association Table
By focusing on the leftmost column of the principal association table, an inference tree on the defect type function may be built. This is the binary tree shown in Figure 10. The root of this tree represents the first verification stage of the software development process with which function is principally associated. The levels of the tree represent subsequent verfication stages that are pricipally associated with function. The number of levels of the tree correspond to the number of principally associated verification stages plus one, to include the stage that follows the last principally associated stage. Thus, we have high level design inspection, function verification test, and system test. At each of these stages, it is determined whether there were too few (Low) or too many (High) defects of type function, where the criteria for High and Low are determined with experience. These two outcomes yield a binary tree. Paths from the root of the tree to a leaf node are development experiences and there are as many paths as leaf nodes. Against each leaf node are inferences that provide an assessment on the process. A High after the system test node indicates that the design is still exposed, whereas a Low after the system test node could mean that the design is either not exposed or has been already corrected, depending on what happened at a prior node. For instance, the sequence H-L-H implies that the design is exposed, and probably function verification test did not do as good a job, leaving system test to do it. Thus, revamping function verification test is indicated.
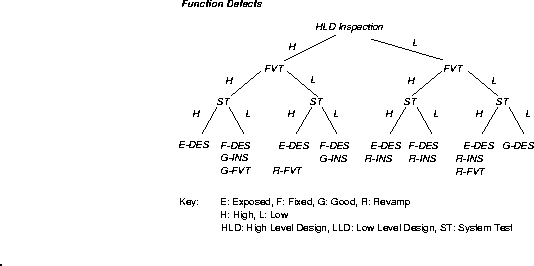
Figure 10: Process Feedback using Inference Tree - Function Defects
The above example illustrates the use of ODC to provide feedback. In more recent work, we have developed algorithms to automatically generate, from the principal association table, the trees and the inferences associated with a development experience. Thus, it allows adapting the inference to a new process simply by re-initializing the principal association table. Details of the inferencing and profiling of the process association can be found in [23].
The Defect Trigger Attribute
A defect trigger is a condition that allows a defect to surface [24]. For instance, when a product is shipped it is assumed that all the functions and operations are tested. However, in the field a series of circumstances may allow a defect to surface that otherwise would not occur in the test environment. It may be that the system had to get into recovery to uncover a checking defect type or a checking defect type does not occur until the software is run under a new hardware platform. Thus, although the defect type is the same, it might take different triggers to work as a catalyst for the defect to surface. In the field, the trigger can potentially be identified by the customer engineer, or someone experienced in problem diagnosis. Thus, triggers, unlike defect types, are identified early in the life cycle of a defect.
The concept of the trigger provides insight not on the development process directly, but on the verification process. Ideally, the defect trigger distribution for field defects should be similar to the defect trigger distribution found during system test. If there is a significant discrepancy between the two distributions, it identifies potential holes in the system test environment. This is particularly useful when a product is sent out to an early ship customer prior to general availability. The difference in trigger distribution between early ship and system test could be used to enhance the test plans in order to cut the potential field defect exposure.
Pilot Results
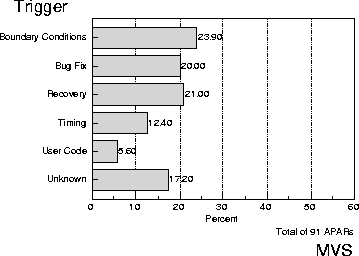
Figure 11: Trigger Distribution of MVS APARs for Main Storage Corruption
Figure 11 shows a trigger distribution of the field defects or Authorized Program Analysis Reports (APARs as they are called in IBM) from the MVS operating system. This distribution is taken from [24] where the contribution of a specific type of software error, main storage corruption, is analyzed. The trigger distribution quantifies the circumstances under which this particular defect surfaces, and this has been useful in disproving a common belief that timing was the primary trigger for these defects surfacing in the field. In fact, timing triggered only 12.4% of main storage corruption defects, whereas boundary conditions were the dominant agent. Thus, system testing different hardware platforms is not as critical as inspections looking specifically for boundary conditions. This point is key to the importance of classifying and tracking defect triggers. Prior to this defect analysis, the most obvious and logical choice for uncovering these defects would have been a variety of hardware configurations. But after the analysis, it became clear that low level code inspection instead will uncover many more main storage corruption defects for the same, or less, investment.
Figure 12 compares the trigger distribution of two Database products, DB2 and IMS taken from [22]. The data are from APARs that aggregates around three years of field life. The trigger distributions show that while most of the DB2 triggers are due to stress or workload related, the ones for IMS are much more evenly distributed across several triggers. It is likely that the younger product (DB2) sees more new environments, the IMS product has a much more stable workload base. These data clearly identify areas for resource expenditure to maximize the results from a system or product test.
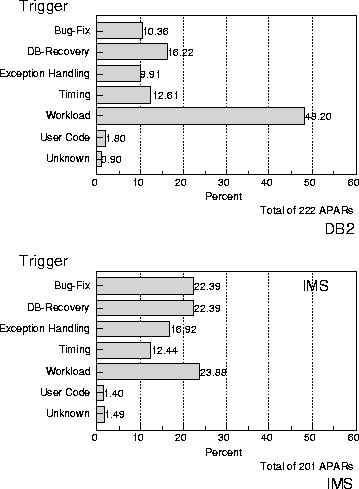
Figure 12: Trigger Distributions for DB2 and IMS
The above discussion referred specifically to triggers that apply from the system test stage into the field. These triggers do not apply at function test or unit test, since under those circumstances, the test case is itself the trigger that allowed the defect to surface.
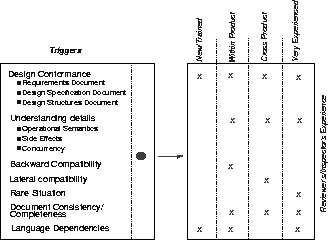
Figure 13: High Level Design Triggers and Relationship to Experience
Document Review and Code Inspection Triggers
The concept of the trigger fits very well into assessing the effectiveness and eventually the completeness of a design review. In this review, the design specification document which defines the functionality of a software product and the design structures document which describes the details of implementing this same product are sent out to several people who in-turn send back their comments. A critical part of this review process is to assess whether these design documents have been reviewed by enough people with the right skill level. The importance of such assessment cannot be understated, since the process that follows design reviews implements and inspects the code for this product. Hence, any missing or incorrect information will have a serious impact on testing and maintaining this product.
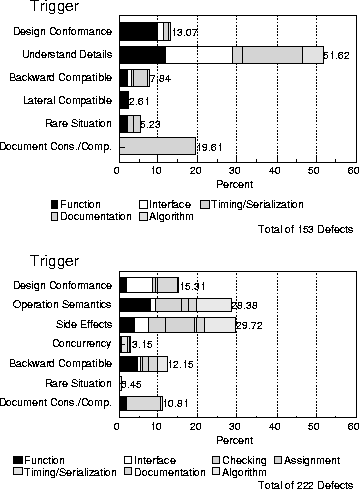
Figure 14: Trigger Distributions through High and Low Level Design Reviews
Figure 13 presents a list of triggers as they apply to the review of a design document. The set has been derived by considering the activities performed by different reviewers in accomplishing their task. Some reviewers look for details in the process of understanding what is written. Such details may include concurrency when the control of shared resources is being studied, operational semantics when the flow of logic required to implement a function is examined, or the side effects of executing such function. Other reviewers look at the conformance of the defined services with preceding requirements and design documents. Similar activities include examination of compatibility issues both backwards and laterally with other products, checking for inconsistencies and missing sections within the document, inspecting the language-specific details of the implementation of a component, and searching for a rare situation that has not been considered or addressed in the design document under review.
For each of these triggers, one can assess the skill required by the reviewer. Figure 13 also shows the skill level appropriate for each trigger. Note that some of the triggers, such as looking for details, may not require substantial knowledge or experience of the subject product, whereas lateral compatibility clearly indicates the need for people with skill in more than just the product or component under review. Similarly, backward compatibility requires people with experience within the component or product. People who can identify rare situations need a lot of experience, either with the product or otherwise.
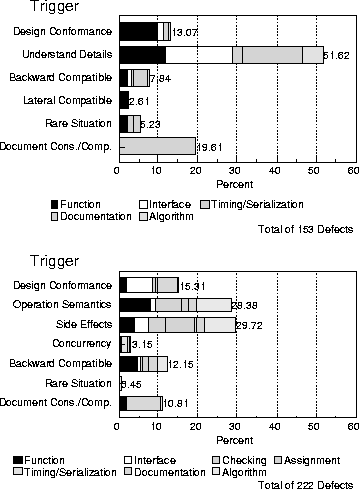
Figure 15: Trigger Distribution in Code Inspection
Given that we can map the defect triggers to skills required to find the defect type, we can again exploit the defect trigger distribution to gain insight into the effectiveness of the review. It is common to also have several reviews of the document, each incorporating the accepted comments from the earlier one. Thus, one can look at the change in the trigger distribution to see if it reflects anticipated trends, similar to the defect type distribution.
Figure 14 shows the trigger distribution of defects from a high level and low level design reviews respectively. Whereas, Figure 15 shows the trigger distribution from a code inspection. The corresponding defect type distributions were shown in Figure 5 and Figure 6 respectively. Although, these trigger distributions have not yet been calibrated, the information is still useful. Given the characteristics of a software product, the cross product of the defect type and the trigger, in the mathematical sense, provides a measure of the effectiveness of the verification method in identifying defects from this process. Thus, in the case of Figure 14, a software product with significant interactions with other products, the lack of any interface defects that are triggered by lateral compatibility is suspicious. It can imply either an excellent development or a deficient design review. Looking through the skill base of the review team and the defect types they identified, it became evident that the review team lacked skills in cross product experience. Subsequently, a second design review was initiated and these same triggers were used to assess the effectiveness of this review. Thus, the defect trigger helped provide feedback on the effectiveness of the verification process, the review, of a design.
The small number of defects that were found by checking for concurrency, backward compatibility, and lateral compatibility issues in Figure 15 has also been a cause of concern. Members with good experience in the product were subsequently asked to reinspect the code in order to help find more defects that are triggered by compatibility concerns.
Implementing ODC
The cost impact on an individual software engineer during the development process is minimal. Typically, measured in the order of a dozen keystrokes per defect to fill out one or two panels. The incremental time is probably negligible once one enters a tracking system to track the defect. We have measured anywhere from less than a minute up to four minutes depending on the tracking system. There is an initial setup cost which involves education, tool changes, and process changes to get ODC started. Currently some of our education classes run a total of 3 hours which include a lab session. To provide a workable framework within the development lab, a process needs to be defined for the analysis and feedback of the data with owners responsible for the activities. Depending on the degree of deployment within a lab, we have the ODC ownership completely within a development team in the case of a few projects, or under a process manager when used for the whole lab.
One of the natural extensions of ODC is to assist the Defect Prevention Process (DPP) [6]. DPP identifies the root cause of defects and creates action that prevent the re-occurrence of such defects. ODC data provides a fertile environment where analysis can identify hot-spots and report situations without human analysis of each defect. Essentially, ODC provides a very low-cost method to bring issues to the table and rank order them in terms of impact. Furthermore, ODC is not limited by human attention span in looking at several problems or across several databases to make inferences. Thus, ODC can be used to focus DPP and the DPP process can be leveraged by devoting time to the hot-spots and not laboring over reams of data.
Summary
This paper addresses a key issue of measurement in the software development process, i.e., feedback to the developer. Without feedback to the development team, the value of measurement is questionable and defeats the very purpose of data collection. Yet, feedback has been one of the biggest challenges faced, and not without reason. At one end of the spectrum, research in defect modeling focused on reliability prediction treating all defects as homogeneous. At the other end of the spectrum, causal analysis provided qualitative feedback on the process. The middle ground did not develop systematic mechanisms for feedback due to the lack of fundamental cause-effect relationship extractable from the process. This paper builds on some fundamental work that demonstrated the existence of a relationship between the type of defects found and their effect on the development process. The major contributions of this paper are:
- Orthogonal Defect Classification which provides a basic capability to extract signatures from defects and infer the health of the development process. The classification is to be based on what was known about the defect such as its defect type or trigger and not on opinion such as where it was injected. The choice of the classes in an attribute should satisfy the stated necessary and sufficient conditions so that they eventually point to the part of the process that requires attention.
- The design of the defect type attribute to measure the progress of a product through the process. Defect type identifies what is corrected and can be associated with the different stages of the process. Thus, a set of defects from different stages in the process, classified according to an orthogonal set of attributes, should bear the signature of this stage in its distribution. Moreover, changes in the distribution can meter the progress of the product through the process. The departure from the distribution provides alert signals pointing to the stage of the process that requires attention. Thus, the defect type provides feedback on the development process.
- The design of the defect trigger attribute to provide a measure of the effectiveness of a verification stage. Defect triggers capture the circumstance that allowed the defect to surface. The information that yields the trigger measures aspects of completeness of a verification stage. The verification stages could be the testing of code or the inspection and review of a design. These data can eventually provide feedback on the verification process. Taken together with the defect type, the cross-product of defect type and trigger provides information that can estimate the effectiveness of the process.
- Our experience with ODC, which indicates that it can provide fast feedback to developers. Currently, two stage data is used for trend analysis to yield feedback. It is envisioned that as pilots evolve, the measurements can yield calibration. The use of ODC can begin as early as high level design and the paper illustrates data from a selection of pilots using ODC.
- ODC as general concept for in-process measurements. Although this paper has focused its application in software development, it is plausible that similar advancements are possible in other areas. Currently these ideas are being explored, at IBM, in hardware development, information development and non-defect oriented problems.
Acknowledgments
ODC as a concept made significant strides since we could run pilots to experiment with the ideas in a real production environment. Thus, several people have been involved in putting this to practice, not all of whom can be individually named. We would like to mention a few people and some important milestones in its history. Lip Lim, the then development manager, at IBM's Mid-Hudson Valley Programming Lab recognized the ideas and promoted the very first pilots. Our efforts in applying ODC to cover the design area stemmed from our joint work with IBM's Santa Teresa Lab. Chris Byrne's untiring enthusiasm and Ron Peterson's pilot work gave us a head start in the lab where Tom Furey, the lab director, helped move ODC into production. During the initial stages of ODC development, our joint-program manager, Marge Schong, helped find avenues to bring ODC into the mainstream of IBM development. Also, our management team at Research, George Wang and Jeff Jaffe, provided a strong source of encouragement and support.
References
J. Gray, ``A Census of Tandem System Availability between 1985 and 1990,'' IEEE Transactions on Reliability, vol. 39, Oct 1990.
IEEE Software, ``Theme Articles: Reliability Measurement,'' IEEE Software, vol. 9, July 1992.
J. D. Musa, A. Iannino, and K. Okumoto, Software Reliability - Measurement, Prediction, Application. McGraw-Hill Book Company, 1987.
C. V. Ramamoorthy and F. B. Bastani, ``Software Reliability - Status and Perspectives,'' IEEE Transactions on Software Engineering, vol. 8, no. 4, pp. 354-371, 1982.
A. L. Goel, ``Software Reliability Models: Assumptions, Limitations, and Applicability,'' IEEE Transactions on Software Engineering, vol. 11, no. 12, pp. 1411-1423, 1985.
R. Mays, C. Jones, G. Holloway, and D. Studinski, ``Experiences with Defect Prevention,'' IBM Systems Journal, vol. 29, no. 1, 1990.
W. S. Humphrey, Managing the Software Process. Addison-Wesley Publishing Company, 1989.
B. Littlewood and J. L. Verrall, ``A Bayesian Reliability Growth Model for Computer Software,'' Journal of Royal Statistical Society, vol. 22, no. 3, pp. 332-346, 1973.
M. Ohba, ``Software Reliability Analysis Models,'' IBM Journal of Research and Development, vol. 28, July 1984.
IEEE Standards, ``Standard for Software Quality Metrics Methodology,'' Software Engineering Standards Subcommittee, vol. Standard P-1061/D21 - Unapproved Draft, April 1990.
IEEE Software, ``Theme Articles: Metrics,'' IEEE Software, vol. 7, March 1990.
V. R. Basili and B. T. Perricone, ``Software Errors and Complexity: An Empirical Investigation,'' Communications of the ACM, vol. 27, no. 1, 1984.
V. R. Basili and H. D. Rombach, ``The TAME Project: Towards Improvement Oriented Software Environments,'' IEEE Transactions on Software Engineering, vol. 14, pp. 758-773, June 1988.
IEEE Standards, ``A Standard Classification of Software Errors, Faults and Failures,'' Technical Committee on Software Engineering, vol. Standard P-1044/D3 - Unapproved Draft, December 1987.
R. Chillarege, W.-L. Kao, and R. G. Condit, ``Defect Type and its Impact on the Growth Curve,'' in Proceedings of The 13th International Conference on Software Engineering, 1991.
IBM MHVPL PTM Work Group, Requirements for Program Trouble Memorandas. IBM Mid Hudson Valley Programming Lab, Myers Corners Road, Wappingers Falls, NY 12590, 1990.
A. Dooley, et.al., ``Specifying a Change Management Process and Tool,'' In Preparation, 1992.
IBM Research ODC Project, ``Orthogonal Defect Classification - Data Definitions and Requirements,'' Working Document, vol. Request Document, no. IBM Watson Research, Attn: R. Chillarege, Box 704, Yorktown Heights, NY 10598, 1992.
R. Chillarege and D. P. Siewiorek, ``Experimental Evaluation of Computer Systems Reliability,'' IEEE Transactions on Reliability, vol. 39, October 1990.
R. A. Radice and R. W. Phillips, Software Engineering: An Industrial Approach. Prentice Hall, 1988.
B. Ray, I. Bhandari, and R. Chillarege, ``Reliability Growth for Typed Defects,'' in Proceedings of The IEEE Reliability and Maintainability Symposium, pp. 327-336, 1992.
M. Sullivan and R. Chillarege, ``A Comparison of Software Defects in Database Management Systems and Operating Systems,'' in Digest of Papers The 22nd International Symposium on Fault-Tolerant Computing, pp. 475-484, 1992.
I. Bhandari, M.-Y. Wong, R. Chillarege, B. Ray, and D. Choi, ``An Inference Structure for Process Feedback: Technique and Implementation,'' Tech. Rep. RC 17869, (Log 78400), IBM Research, 1992.
M. Sullivan and R. Chillarege, ``Software Defects and their Impact on System Availability - a study of Field Failures in Operating Systems'', in Digest of Papers The 21st International Symposium on Fault-Tolerant Computing, pp. 2-9, 1991.
J.K. Chaar, M.J. Halliday, I.S. Bhandari, and R. Chillarege, "In-process metrics for software inspection and test evaluations," Tech. Rep. 80725, IBM Research, 1992.
Search form
Search
TechBriefs
Title
Fast Abstracts - the idea and the origin.
5 Differences between Classical and ODC Root Cause Analysis in Software
Tutorial at ISSRE, Pasadena CA
Orthogonal Defect Classification - ODC
Conflicting forces for Software Reliability in e-Business
Fast Abstracts - Launching the idea
Tech Papers
Title
Software Testing Best Practices
Top Five Challenges Facing the Practice of Fault-tolerance
Measurement of Failure Rate in Widely Distributed Software
Early Warning of Failures through Alarm Analysis - A Case Study in Telecom Voice Mail Systems
Understanding Large System Failures - A Fault Injection Experiment
Software Triggers as a Function of Time - ODC on Field Faults
ODC Deep-Dives for Rapid Holistic Product Development Insight
The Marriage of Business Dynamics and Software Engineering
Test and Development Process Retrospective - a Case Study using ODC Triggers
Guiding fault-injection and broadening its scope using ODC Triggers
Why are ODC Triggers fundamental to Software Test Measurement?
Reflections on Industry Trends and Experimental Research in Dependability
Identifying Risk Using ODC Based Growth Models
ODC for Process Measurement, Analysis and Control
Experiment illustrating Failure Acceleration and Error Propagation in Fault-Injection
Orthogonal Defect Classification - A Concept for In-Process Measurements
Generation of an Error Set that Emulates Software Faults based on Field Data
ODC - a 10x for Root Cause Analysis
Defect Type and its Impact on the Growth Curve
Discovering Relationships between Service and Customer Satisfaction
Copyright © 2015, chillarege. All Rights Reserved .